EDIT: So after the first class, I knew essentially what I was interested in doing for a final project. A little context: My dream is to work for Major League Baseball. I’m currently a freelancer/independent contractor for them in their QA department – I place baseball video games all day – and hope to continue climbing the ladders they provide for me. As a result, a fair amount of the work I produce at ITP is baseball related. Baseball provides me with a context that makes learning new tech just a little bit easier.
With that said, for this assignment, I want to see if there is any correlation between placement of a Major League ballpark and surrounding poverty levels. How does a stadium change the community in which it’s placed? I know this is a bigger project than a final but I figure for the final I can bring in poverty levels of all the areas in which a stadium is located and compare them to poverty levels PRE the building of that stadium. I can also do something where ticket sales are assessed for example: is there a correlation between tickets sales, poverty levels and placement of a stadium.
Below is just information I’ve begun to gather about the poverty rate in each county where the ballpark is located.
Is it better to look at avg attendance per game or total?
Source for all information: US Census Bureau – http://www.census.gov/quickfacts/table/PST045216/00
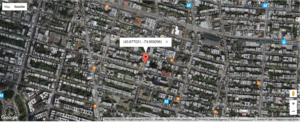
Angel Stadium of Anaheim in Anaheim, California – Poverty Rate – 16.5%. Total 3,016,142 AVG 37,236 (7th)
AT&T Park in San Francisco – Poverty Rate – 13.2% Total – 3,365,256. AVG – 41,546 (4th)
Busch Stadum – St.Louis, Missouri – 27.1% Total – 3,444,490. AVG – 42,524 (2nd)
Chase Field – Phoenix, Arizona – 23.1% Total 2,036,216 AVG 25,138 (21st)
Citi Field – Queens, NY – 13.9% Total 2,789,602 AVG 34,870 (9th)
Citizens Bank – Philadelphia, PA – 26.4% Total 1,915,144 AVG 23,643 (24th)
Comerica Park – Detroit, MI – 40.3% Total 2,493,859 AVG 31,173 (13th)
Coors Field – Denver, Colorado – 17.3% Total 2,602,524. AVG 32,129 (11th)
Dodger Stadium – Los Angeles, CA – 22.1%. Total – 3,703,312. AVG – 45,719 (1st)
Fenway Park – Boston, Massachusetts – 21.5% Total – 2,955,434. AVG – 36,486 (8th)
Globe Life Park in Arlington – Arlington, TX – 17.5% Total – 2,710,402 AVG 33,461(10th)
Great American Ballpark – Cincinnati, OH – 30.5% Total – 1,894,085 AVG 23,383 (25th)
Guaranteed Rate Field – Chicago, Illinois – 22.3% Total 1,746,293 AVG 21,828 (26th)
Kaufmann Stadium – Kansas City, MI – 19.0% Total 2,557,712 AVG 31,576 (12th)
Marlins Park – Miami, FL – 28.3%Total 1,712,417 AVG 21,405 (27th)
Miller Park – Milwaukee, WI – 28.7% Total 2,314,614 AVG 28,575 (16th)
Minute Maid Park – Houston, TX – 22.5% Total 2,306,623 AVG 28,476 (17th)
Nationals Park – Washington D.C – 18.0% Total 2,481,938 AVG 30,641 (14th)
Oakland Coliseum – Oakland, CA – 20.4% Total 1,521,506 AVG 18,784 (29th)
Oriole Park at Camden Yards – 23.7% Total 2,172,344 AVG 26,819 (20th)
Petco Park – San Diego, CA – 15.4% Total 2,351,426 AVG 30,641 (15th)
PNC Park, Pittsburgh, PA – 22.9% Total 2,249, 021 AVG 28,112 (18th)
Progressive Field – Cleveland, OH – 36.2% Total – 1,591,667 AVG 19,650 (28th)
Rogers Centre – Toronto, ON – 13.1 % Total – 3,392,299. AVG – 41,880 (3rd)
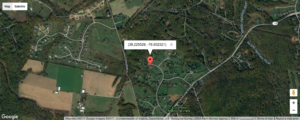
SunTrust Park – Cumberland, GA – 11.4%** new stadium, only county data available NA
Safeco Field – Seattle, WA – 13.5% Total 2,267,928 AVG 27,999 (19th)
Target Field – Minneapolis, MN -21.9% Total 1,963,912 AVG 24,245 (23rd)
Tropicana Field – St. Petersburg, FL – 17.2% Total 1,286,163 AVG 15,878 (30th)
Wrigley Field – Chicago, Illinois – 22.3% Total 3,232,420 AVG – 39,906 (5th)
Yankee Stadium, Bronx, NY – 30.3% Total 3,063,405 AVG – 37,819 (6th)