Title:
Forces in Baseball
What is it:
A physics engine that looks to simulate the effects of various aspects of air density – humidity, temperature, altitude – and wind on a baseball.
Visual Mock-Up:
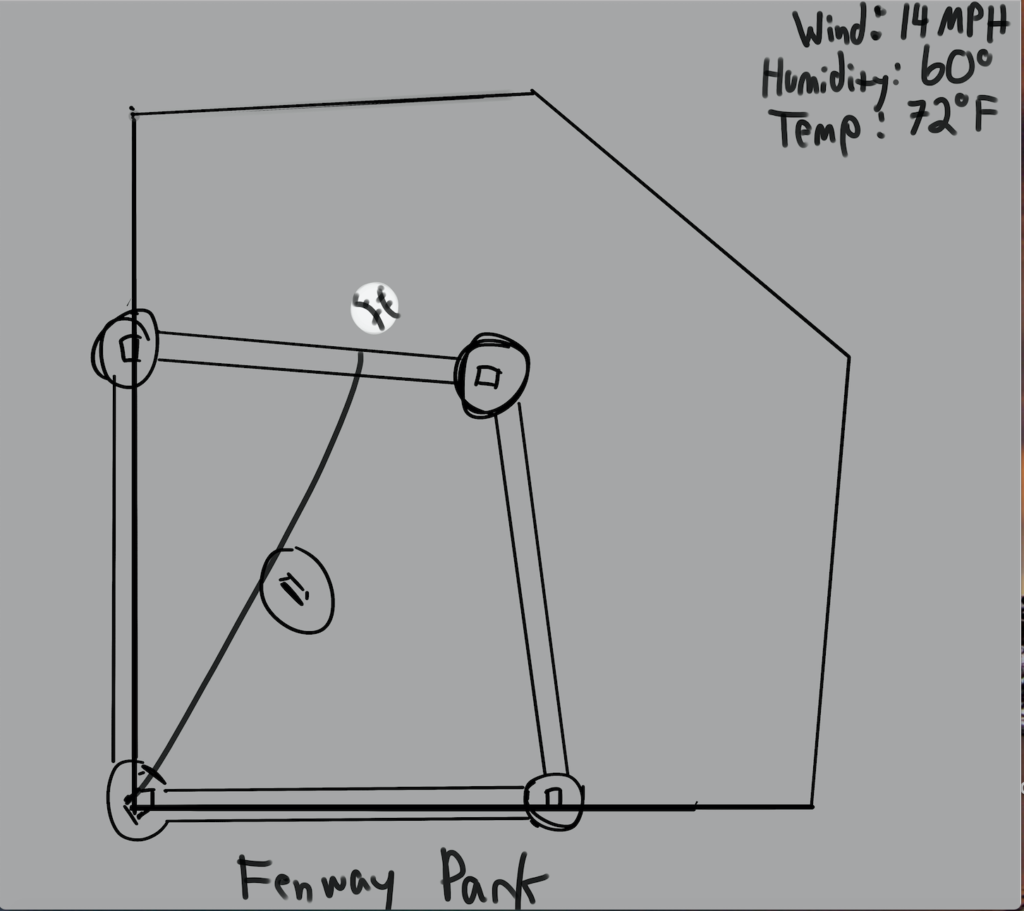
Sketch:
Status Update:
As I’ve started to explore this assignment I’ve realized how incredibly vast an undertaking it is. I feel like the best way to go about doing this is to reverse engineer a home run to see what factors I need to take into account, and how to take them into account going forward. So, I’ve decided to start with what was – by StatCast’s measurements – the HR that had the highest projected distance in 2016: Giancarlo Stanton’s solo shot against the Colorado Rockies on August 8th, 2016.
Here are things that I know about the home run:
- Distance: 504 feet
- Exit Velocity: 115.8
- Launch Angle: 18.3
- Height:72.3 Feet
- Temperature: 75 degrees
- Wind: 13.8 MPH ENE
- Barometric Pressure: 29.85 Hg
- Average Humidity: 55%
- Weight of baseball: 145 g or 0.31967 lbs
- Hangtime: 5.4 seconds
Statcast data: http://m.mlb.com/statcast/leaderboard#hr-distance
Weather features found: https://www.wunderground.com/history/airport/KDEN/2016/8/6/DailyHistory.html?req_city=&req_state=&req_statename=&reqdb.zip=&reqdb.magic=&reqdb.wmo=&MR=1
So how do I put these things in code? I know how to create different forces and how to apply them to different objects but what is the best way to proceed. I imagine it’s by starting with the ball at home plate with no forces applying to them. Then changing velocity and acceleration to launch angle and bat speed as those are two determining factors as to how far a home run is hit. Then applying all of the other aforementioned forces. I have difficulty weighting the forces though: which has more of an impact. Also, how do I determine the mapping of exit velocity? Find the highest and lowest measurement of 2016?
Everything below is personalized questions and notes so you don’t need to read further if you don’t like.
Questions:
When you’re applying a force, you’re essentially changing acceleration, correct? Because acceleration = that new force. This doesn’t negate the acceleration that’s already in there, correct?
The forces that I need to put into a sketch all fall under categories that effect air density: temperature, humidity, and altitude. The higher the altitude, the lower the air density, the further the ball flies.
How do I make a force effect the entire sketch? Like I need air density to be a blanket that slows down the entire sketch.
Is the best thing than to recreate a home run using the data that we have? Like Stanton hit a HR in Coors that went a projected 504 feet, with an exit velo of 115.8, a launch angle of 18.3. The inning was the top of the 5th so the temperature was about 75 degrees, wind was about 14 mph and was blowing NE.
Check out Alan Nathan, physics professor
5 things that can affect a baseball game from this accuweather article:
- Air temperature can change a baseball’s trajectory. A ball coming off the bat at 100 mph with a 30 degree launch angle will travel about 2.5 feet less in 60 degree weather as compared to 70 degree weather. That’s not a big difference in this context but games in April are played in 40 degree weather while a game in the same ballpark in August can be played in 90 degree weather. That’s a 10 feet difference which can easily be the difference between a fly ball and a home run.
- Air density. Look at Coors Field in Colorado which is a mile above sea level and therefore has less air density than your average baseball stadium. The balls used in this stadium at stored in a humidor at a constant 50% relative humidity and at 70 degrees to help change the coefficient restitution or bounciness of the ball. The ball becomes a bit heavier and the ball doesn’t come off the bat as fast and doesn’t quite travel as far. What is the average mass of a baseball?(it’s 145 grams).Due to the density of the air, breaking balls like Curveballs and Sliders will not break as much in less dense air. Pitchers perform better at Coors when it’s colder because the ball will spin more.
- High and low temperatures If you are sweating a lot, it’s harder to feel the ball and get a good grip on it. Same thing if it’s too cold, the batter will lose feeling in his fingers.
- Cloud Coverage A bright blue sky – or high sky – can cause problems with depth where as clouds can cover up the ball.
- Wind Some pitchers that rely on movement from their breaking pitches prefer to have the wind in their face, they think it will add movement to their pitches while some feel the opposite.
Notes from Alan Nathan’s “You Can Observe A Lot By Watching”
- Quotes from The Physics of Baseball by Robert K. Adair
- “Our goal is not to reform the game but to understand it”
- “The physics of baseball isn’t rocket science. It’s much harder”
- The bat will slow down after contact is made with the pitch
- The bat is not a rigid object, and the further away from the “sweet spot” the hit is, the more the bat will vibrate or even splinter in half.
- Queue up to 18:19 to see the different vibrations of a bat
- The sweet spot is the node on a bat where vibration would be smallest. That’s why it hurts a bit when you get a hit o the sweet spot. At the sweet spot vibrations are minimized.
- The manner at which a bat breaks depends on where the impact occurs. If the impact occurs on the end of the bat then it bends towards the pitcher and that’s the way it breaks. Compare that to when the bat breaks closer to the barrel and it cracks towards the catcher.
- The ball doesn’t know the end of the bat is even there because the impact takes 1/1000 of a second.
- The batter could just let go of the bat just prior before making contact with the ball and it wouldn’t make a difference to what happens with the ball. This means: if a bat is swung at a certain speed, it doesn’t matter who is holding that bat.
- Look at Todd Frazier’s 5/30/12 home run. Ball hit 375 feet and the bat was barely in his hands. Grip doesn’t matter.
Nasty, Nasty, Nasty
- Ball swerves in direction that leading edge is turning
- Pitch F/X. Created by Marv White
- two video cameras @ 60 FPS set up in each ballpark above first base line and above home plate
- Tracks every pitch in every ballpark
- “Hitting is fifty percent above the shoulders” — Ted Williams & “Hitting is timing; pitching is upsetting timing” — Warren Spahn
- Control: the ability to throw strikes. Command: the ability to throw well located strikes
- Movement: how much a pitch deviates from a straight line.
- For Jon Lester’s 4 seam there is back spin which means the force is actually moving upward, it drops because of gravity but the force due to the spin is upwards. It also breaks slightly to the side, bearing in to a LHH.
- A knuckleball has no spin whatsoever, it has to do with how the seams are oriented. If the ball is barely spinning or spinning slowly, the seams have the most effect on the ball. If the ball were perfectly smooth there would be no knuckleball effect. Small changes in how you release that ball can cause big changes in what happens to the ball when it gets to home plate.
Three For the Price of One
- Backspin on the ball because the ball slides along the surface of the bat temporarily and the friction between the ball and the bat acts in the opposite direction
- If a batter is out in front of a ball it will move towards left field if he is a right handed batter and towards right field if he is a left handed batter. Ball begins to spin counter clockwise.
- Live drives in the outfield curve towards the foul pole
Building a worse mouse trap
- When a ball hits a wooden bat, the ball’s surface will change but the wooden bats won’t. All of the energy of the collision is taken up by the ball when it squashes, not the wooden bat. That’s super inefficient.
- When you get a hit with the aluminum bat something called the trampoline effect occurs. Result of trampoline effect: less energy lost in the bat.
- Ball bat coefficient of restitution. When it’s large the performance of the bat is better when it’s small the performance of the bat is worse. BBCOR of a wood bat is about 0.5. You want to regulate the performance of the bat’s you regulate the BBCOR.
Extra Innings: The Carry of a Fly Ball
- Three pieces of information about every home run:
- Precise landing point of the home run
- The time it takes to travel from contact to landing
- And initial speed and angle
- With that information you can do…
- What does it mean when you say the ball “carries well”. If you look at the actual distance the ball traveled compared to how it would travel in a vacuum, if there were no air effects and only gravity it would travel one distance and with air effects it would travel another
- If you take the same initial velocity of a home run and say how far would this go if there were no air, gravity but no air, it would travel 571 feet. With air effects it goes about 397. 397/571 is 0.695. So 0.695 is the carry.
- Look up Alan Nathan’s Normalized Carry done in 2009
- The ball carries very well in Denver but doesn’t carry in Cleveland.
- Denver is a mile above sea level and the air density is roughly 80% of what it is at sea level so the bar carries further because there is less air. A ball that would travel 400 feet would travel 425 in Denver.
- When the temperature is high, the air density is less and the ball carries further.