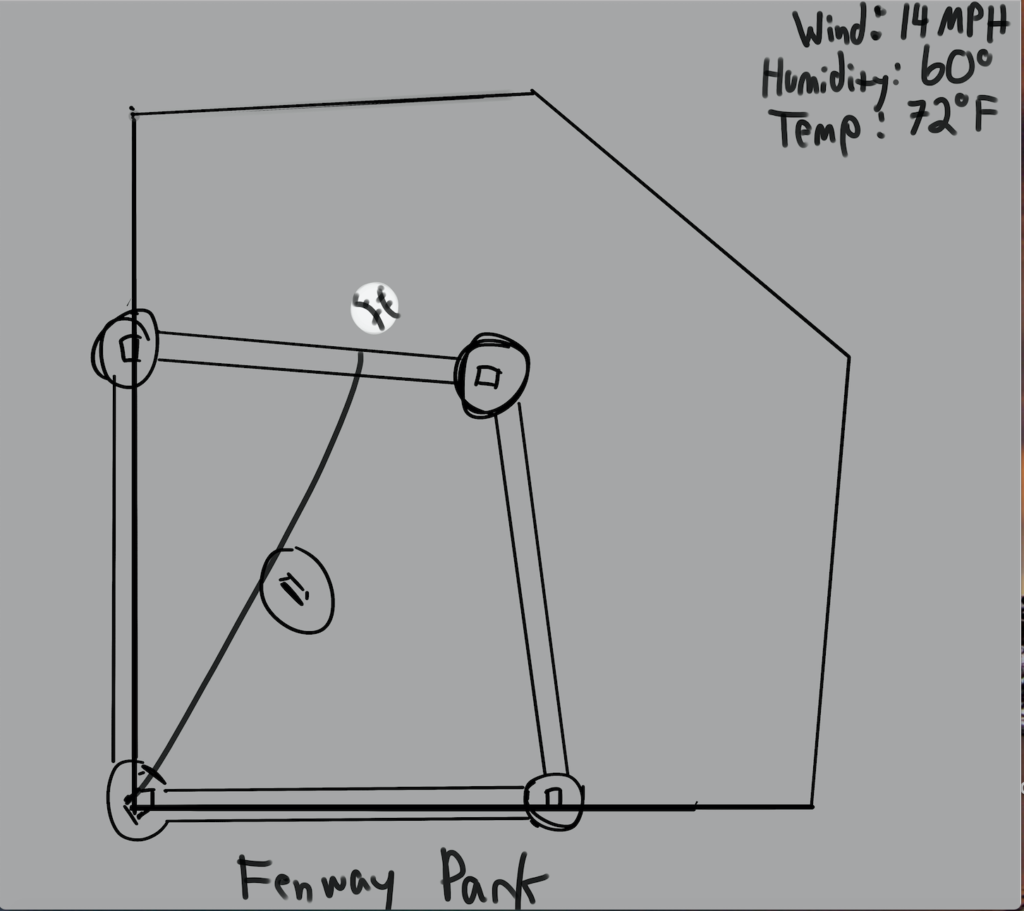
Forces in Baseball
A physics engine that looks to simulate the effects of various aspects of air density – humidity, temperature, altitude – and wind on a baseball.
As I’ve started to explore this assignment I’ve realized how incredibly vast an undertaking it is. I feel like the best way to go about doing this is to reverse engineer a home run to see what factors I need to take into account, and how to take them into account going forward. So, I’ve decided to start with what was – by StatCast’s measurements – the HR that had the highest projected distance in 2016: Giancarlo Stanton’s solo shot against the Colorado Rockies on August 8th, 2016.
Here are things that I know about the home run:
Statcast data: http://m.mlb.com/statcast/leaderboard#hr-distance
Weather features found: https://www.wunderground.com/history/airport/KDEN/2016/8/6/DailyHistory.html?req_city=&req_state=&req_statename=&reqdb.zip=&reqdb.magic=&reqdb.wmo=&MR=1
So how do I put these things in code? I know how to create different forces and how to apply them to different objects but what is the best way to proceed. I imagine it’s by starting with the ball at home plate with no forces applying to them. Then changing velocity and acceleration to launch angle and bat speed as those are two determining factors as to how far a home run is hit. Then applying all of the other aforementioned forces. I have difficulty weighting the forces though: which has more of an impact. Also, how do I determine the mapping of exit velocity? Find the highest and lowest measurement of 2016?
Everything below is personalized questions and notes so you don’t need to read further if you don’t like.
Questions:
When you’re applying a force, you’re essentially changing acceleration, correct? Because acceleration = that new force. This doesn’t negate the acceleration that’s already in there, correct?
The forces that I need to put into a sketch all fall under categories that effect air density: temperature, humidity, and altitude. The higher the altitude, the lower the air density, the further the ball flies.
How do I make a force effect the entire sketch? Like I need air density to be a blanket that slows down the entire sketch.
Is the best thing than to recreate a home run using the data that we have? Like Stanton hit a HR in Coors that went a projected 504 feet, with an exit velo of 115.8, a launch angle of 18.3. The inning was the top of the 5th so the temperature was about 75 degrees, wind was about 14 mph and was blowing NE.
Check out Alan Nathan, physics professor
5 things that can affect a baseball game from this accuweather article:
Notes from Alan Nathan’s “You Can Observe A Lot By Watching”
Nasty, Nasty, Nasty
Three For the Price of One
Building a worse mouse trap
Extra Innings: The Carry of a Fly Ball
UPDATE: FINAL CODE HAS BEEN ADDED TO THE BOTTOM OF THE PAGE
I don’t know if a lot of you are aware but it is very, very difficult to be a Major League Baseball Player. In most professional sports, there are few steps: you play in college, you get drafted, and if you prove good enough you get to play professional football, hockey or basketball. This is not the case in Major League Baseball. If you are 100% the best player in college, if there has never been anyone like you to play the game at the rare age of 18 or 21 you are still placed in a brutal minor league system that can completely control your soul. Let’s take a look at a trailer for the film “A Player to be Named Later” for more information.
I asked this question to give you a better idea of why I love this sport so much: it’s not just a sport it’s a story that grows and changes every single year and never gets boring. There are truly millions of examples of this but let’s stick with one that happened this past year. For those who don’t know, pitchers rarely get the chance to hit. A typical batter will get upwards of 600 – 700 opportunities to get a hit and a pitcher may get like…50 at most. Michael Lorenzon, a pitcher for the Reds this year – got five. Five opportunities to just get a hit. On around August 12th, Michael Lorenzon’s father – whom he was very close with – passed away. After returning from a bereavement list, Lorenzon was put into the game for his team.
This is why I love baseball.
As is true with all things you love, you want to know more about it and maybe try to instill some of that information in others.
When I started learning coding awhile ago, I was a bit terrified because I was in an unfamiliar place. However, when I started using baseball statistics in coding, the experience of discomfort lessened. Coding became secondary, a byproduct of needing to learn how to make baseball more accessible. I started with a simple baseball game:
When I made this, I was super excited. I had finally made a baseball game! Very strange to look back on it now. The evolution of the game is entirely thanks to the introduction of JSON files. They gave me the opportunity to take real baseball data – of which there is an abundance – and apply it to my work. I’ll never forget being late to a bar that night because I was so excited to make this:
After I had fun with this, I decided why not mix the two, which led me to my final. How cool would it be if I could take real data and use it to show the difference in a pitchers arsenal. I’ve seen plenty of videos and .gif’s but something about visualizing the data got me really excited. Luckily, I found two amazing partners – and fellow baseball fans – in Katie Takacs and Grant Henry and after countless hours we made what can only best be shown in a local host.
Here is the final code:
var gameMode = ‘EASY’;
//EASY MODE
var x = 380;
var y = 285;
var speed = 3.5;
var speedb = 0;
var accx = -0.01;
var deg = 0;
var serial;
var serialTwo;
var serialThree;
var ballX, ballY, ballZ;
var batX, batY, batZ;
var portName = ‘/dev/cu.AdafruitEZ-Link71f3-SPP’; ///dev/cu.AdafruitEZ-Link71f3-SPP; for accelerometer
var portNameTwo = ‘/dev/cu.AdafruitEZ-Link743a-SPP’; ///dev/cu.AdafruitEZ-Link743a-SPP; for buttons
var portNameThree = ‘/dev/cu.usbmodem1421′;//’/dev/cu.usbmodem1411’; or whatever port you’re plugged into for FSR’s
var w = 35;
var prevBallY;
var counter = 150;
var batspeed = 5;
//hits counter variables
var score = 0;
var imgScore;
var bringEm;
var shaggy;
var noMatter;
var swinging = false;
//var getHit = false;
var inData;
var outByte = 0;
//HARD MODE
var sensorValue = 5;
var ball, pitchSelector, data, data2;
var bigList = [];
var speedHard = 3;
//p is from 0-4 and determines which pitcher’s stat’s we’re accessing: 0 is Thor, 1 is kershaw, etc
var p = 1;
//k is however many pitches the pitcher has in their arsenal
var k = 4;
// r is the minimumim vel for each pitcher
var r = 30;
//b is second real value in PitchMapMin
var b = 101.4;
//s is first real value in PitchMapMov
var s = -9.0;
//q is second real value in PitchMapMov
var q = 5;
// changes colors in the switch to make colors unanimous across the board
var cOne = 255;
var cTwo = 255;
var cThree = 0;
var cFour = 244;
var cFive = 66;
var cSix = 66;
//pitchers display variables
var currentImg;
var kershaw;
var mo;
var thor;
var wake;
var yu;
//Wake’s variables. Adj makes his movement start earlier, Knuckle allows for his wacky movement
// to be in the code
var wakeAdj = 400;
var knuckle = 0;
// making JSON data global.
var PitchMax;
var PitchMin;
var PitchMapMov;
var PitchMapMax;
var PitchMapMin;
var PitchMapMov;
var PitchrandomSpeed;
var PitchSpeed;
//GAME MODE
var speedc = 1;
// timer variables
var clockStart = 60;
var interval;
var modeEasy = false;
var modeHard = false;
var modeGame = false;
var modeMenu = false;
function preload() {
img = loadImage(‘backgroundField.png’);
image2 = loadImage(‘Bat.png’);
image3 = loadImage(‘baseball.png’);
image4 = loadImage(‘mainMenu3.png’);
mySound = loadSound(‘Cheer.mp3’);
// load pitchers images
kershaw = loadImage(‘kershawTag2.png’);
mo = loadImage(‘moTag.png’);
thor = loadImage(‘thorTag.png’);
wake = loadImage(‘wakeTag.png’);
yu = loadImage(‘yuTag.png’);
// load easter egg sounds
bringEm = loadSound(‘BringEmOut.wav’);
shaggy = loadSound(‘Boombastic.wav’);
noMatter = loadSound(‘WinNoMatter.wav’);
//load pitcher data
data = loadJSON(‘ReorderedPitcherData.json’, gotData);
data2 = loadJSON(‘ReorderedPitcherData2.json’, gotData2);
}
function setup() {
createCanvas(800, 650);
angleMode(DEGREES);
startTimer();
noMatter.onended(startTimer);
//starts at Kershaw
currentImg = kershaw;
//sensorValue = 1;
serial = new p5.SerialPort(“localhost”, 8083);
serial.on(‘list’, printList);
serial.on(‘data’, serialEvent);
serial.on(‘open’, openPort);
serial.list();
serial.open(portName);
serialTwo = new p5.SerialPort(“localhost”, 8081);
serialTwo.on(‘list’, printList);
serialTwo.on(‘data’, serialEventTwo);
serialTwo.on(‘open’, openPortTwo);
serialTwo.open(portNameTwo);
serialThree = new p5.SerialPort(“localhost”, 8082);
serialThree.on(‘list’, printList);
serialThree.on(‘data’, serialEventThree);
serialThree.on(‘open’, openPortThree);
serialThree.open(portNameThree);
textSize(24);
}
function draw() {
clear();
image(img, -30, -50, width+30, height);
// batMove();
// if(getHit === true){
// //console.log(“buzz?”);
// serial.write(“C”);
// console.log(‘writing c’)
// //console.log(serial.write);
// }
// if(getHit === false){
// serial.write(“L”);
// console.log(‘writing L’)
// }
// background(0);
// fill(255);
// text(batX + ” ” + batY + ” ” + batZ, width/2, height/2);
if (ballX === 0 && ballY === 0 && ballZ === 0 && clockStart === 60){
modeMenu = true;
modeEasy = false;
modeHard = false;
modeGame = false;
}
if(modeMenu === true){
image(image4, 0, 0, width+40, height);
modeEasy = false;
modeHard = false;
modeGame = false;
}
if (ballX > 400){
clear();
modeEasy = true;
modeMenu = false;
modeHard = false;
modeGame = false;
clockStart = 59;
score = 0;
}
if(modeEasy === true) {
//console.log(“why aren’t you swinging”);
printTimerShmimer();
printScore();
baseball();
pitch();
returnball();
bat();
contact();
}
if (ballY > 400){
clear();
modeEasy = false;
modeHard = true;
modeMenu = false;
modeGame = false;
clockStart = 59;
score = 0;
}
if(modeHard === true){
//what causes the ball itself to move
if(typeof ball != “undefined”){
ball.display();
ball.move();
if(ball.inScreen()) {
for (var i = 0; i < data.pitchers[p].pitches.length ; i++){
for (var j = 0; j < data.pitchers[p].pitches[i][“Frequency”]/10; j++){
bigList.push(i);
}
}
pitchSelector = bigList[floor(random(bigList.length))];
//console.log(“pitch selection” + pitchSelector);
ball = new Thor(pitchSelector);
//console.log(“Sensor Value: ” + sensorValue);
}
// pitchDisplay();
}
printScore();
printTimerShmimer();
bat();
contactHard();
// changePitcher();
}
if (ballZ > 400){
clear();
modeHard = false;
modeGame = true;
modeMenu = false;
modeEasy = false;
clockStart = 59;
score = 0;
}
if(modeGame === true){
//pitcher image display
if (typeof currentImg != “undefined”) {
image(currentImg, 80, 5, 125, 250);
}
//what causes the ball itself to move
if(typeof ball != “undefined”){
ball.display();
ball.move();
barDisplay();
if(ball.inScreen()) {
for (var i = 0; i < data2.pitchers[p].pitches.length ; i++){
for (var j = 0; j < data2.pitchers[p].pitches[i][“Frequency”]/10; j++){
bigList.push(i);
}
}
pitchSelector = bigList[floor(random(bigList.length))];
//console.log(“pitch selection” + pitchSelector);
ball = new Thor2(pitchSelector);
//console.log(“Sensor Value: ” + sensorValue);
}
pitchDisplay();
}
//console.log(PitchrandomSpeed);
pitchText();
pitchDisplay();
printScore();
printTimerShmimer();
bat();
contactGame();
changePitcher();
adjustStats();
}
}
//baseball display
function baseball() {
fill(255);
ellipseMode(CORNER);
ellipse(x, y, w, w);
image(image3, x, y, w-1, w-1);
}
//baseball movement
function pitch() {
y = y + speed;
x = x + speedb;
// speedb = speedb + accx * 2;
if (y >= height*2.5) {
y = 235;
}
}
//baseball restarts
function returnball() {
if (x > 800 || x < -100 || y > height*1.65 || y < -900) {
baseball();
x = 380;
y = 285;
speed = 3;
speedb = 0;
}
}
//batter up
function bat() {
translate(245, 450);
rotate(deg);
noStroke();
fill(100, 100, 100, 0);
image(image2, 0, 0, 25, 180);
// console.log(“bat”);
// console.log(swinging);
if (swinging) {
deg = deg – batspeed;
}
if (deg <= -180) {
deg = 0;
swinging = false;
}
var diffY = ballY – prevBallY;
if (batX > 105 && batX < 120 && counter > 150) {
swinging = true;
counter = 0 ;
}
// console.log(deg);
counter++;
prevBallY = ballY;
if (y < 225 || x < 0) {
serial.write(“L”);
}
}
//bat hits ball
function contact() {
var diff = deg + 90;
image(image2, 0, 0, 25, 180);
if (abs(diff) < 10) {
if (y > 442 && y < 558) {
if (!mySound.isPlaying()) {
mySound.play();
serial.write(“C”);
speed = speed * random(-4, -1);
speedb = speedb + random(-10, 5);
// see addScore function…
addScore();
}
}
}
}
//}
// send when an event occurs *GAME MODE*
function Thor2(pitch/*frequency*/) {
this.x = 375;
this.y = 220;
this.speedHard = 1;
this.speedc = 0;
this.w = 10;
this.rgb = [0,200,100];
// noprotect
switch (pitch){
//knuckleball will be
case 0:
//red…fastball
this.rgb = [cFour,cFive,cSix];
//console.log(this.rgb);
break;
case 1:
//yellow… curveball
this.rgb = [cOne,cTwo,cThree];
//console.log(this.rgb);
break;
case 2:
//turqouise … change-up
this.rgb = [66,244,235];
//console.log(this.rgb);
break;
case 3:
//purple… slider
this.rgb = [125,66,244];
//console.log(this.rgb);
break;
case 4:
//lime green…sinker
this.rgb = [0,255,0];
//console.log(this.rgb);
break;
case 5:
// blue …cutter
this.rgb = [0, 0, 205];
//console.log(this.rgb);
break;
case 6:
//orange…two-seamer
this.rgb = [255,165, 0];
//console.log(this.rgb);
break;
default:
this.rgb = [0,200,100];
//console.log(‘no color was passed into ball’);
}
PitchMax = data2.pitchers[p].pitches[pitch].MaxVelo;
PitchMin = data2.pitchers[p].pitches[pitch].MinVelo;
PitchxMov = data2.pitchers[p].pitches[pitch].xMov;
//mapping of maximum velocity
PitchMapMax = map(PitchMax, 50, b, 0, 8);
//mapping of minimum velocity
PitchMapMin = map(PitchMin, r, b, 0, 8);
// mapped xMov of fastball
PitchMapMov = map(PitchxMov, s, q, -7, 4);
// pitch velo will randomly vary between max and min
PitchrandomSpeed = random(PitchMapMax, PitchMapMin);
PitchSpeed = Math.round(random(PitchMin, PitchMax));
this.display = function(){
fill(this.rgb[0],this.rgb[1],this.rgb[2], 100);
image(image3, this.x, this.y, this.w, this.w);
ellipseMode(CORNER);
ellipse(this.x, this.y, this.w-1, this.w-1);
}
this.move = function(){
this.y = this.y + this.speedHard + PitchrandomSpeed;
this.x = this.x + this.speedc;
if(this.y> wakeAdj) {
this.x = this.x + PitchMapMov + knuckle;
}
if (this.y > 400){
this.w = this.w +2;
}
if (this.y < 219) {
this.w = this.w – 1.65;
}
};
this.inScreen = function(){
if (this.y < 225 || this.x < 0) {
serial.write(“L”);
}
if(this.y > height*2 || this.y < -500) {
return true;
}
};
}
// send when an event occurs *HARD*
function Thor(pitch/*frequency*/) {
this.x = 375;
this.y = 220;
this.speedHard = 3.5;
this.speedb = 0;
this.w = 10;
this.rgb = [0,200,100];
// noprotect
switch (pitch){
//knuckleball will be
case 0:
//red…fastball
this.rgb = [cFour,cFive,cSix];
//console.log(this.rgb);
break;
case 1:
//yellow… curveball
this.rgb = [cOne,cTwo,cThree];
//console.log(this.rgb);
break;
case 2:
//turqouise … change-up
this.rgb = [66,244,235];
//console.log(this.rgb);
break;
case 3:
//purple… slider
this.rgb = [125,66,244];
//console.log(this.rgb);
break;
case 4:
//lime green…sinker
this.rgb = [0,255,0];
// console.log(this.rgb);
break;
case 5:
// blue …cutter
this.rgb = [0, 0, 205];
// console.log(this.rgb);
break;
case 6:
//orange…two-seamer
this.rgb = [255,165, 0];
//console.log(this.rgb);
break;
default:
this.rgb = [0,200,100];
// console.log(‘no color was passed into ball’);
}
PitchMax = data.pitchers[p].pitches[pitch].MaxVelo;
PitchMin = data.pitchers[p].pitches[pitch].MinVelo;
PitchxMov = data.pitchers[p].pitches[pitch].xMov;
//mapping of maximum velocity
PitchMapMax = map(PitchMax, 50, b, 0, 8);
//mapping of minimum velocity
PitchMapMin = map(PitchMin, r, b, 0, 8);
// mapped xMov of fastball
PitchMapMov = map(PitchxMov, s, q, -7, 4);
// pitch velo will randomly vary between max and min
PitchrandomSpeed = random(PitchMapMax, PitchMapMin);
PitchSpeed = Math.round(random(PitchMin, PitchMax));
this.display = function(){
fill(this.rgb[0],this.rgb[1],this.rgb[2], 100);
image(image3, this.x, this.y, this.w, this.w);
ellipseMode(CORNER);
ellipse(this.x, this.y, this.w-1, this.w-1);
}
this.move = function(){
this.y = this.y + this.speedHard;
this.x = this.x + this.speedb;
if(this.y> wakeAdj) {
this.x = this.x + PitchMapMov + knuckle;
}
if (this.y > 400){
this.w = this.w +2;
}
if (this.y < 219) {
this.w = this.w – 1.70;
serial.write(“L”);
}
};
this.inScreen = function(){
if (this.y < 225 || this.x < 0) {
serial.write(“L”);
}
if(this.y > height*2 || this.y < -500) {
return true;
}
};
}
function gotData(){
ball = new Thor(0);
}
function gotData2(){
ball = new Thor2(0);
}
// bat hits ball
function contactHard() {
var diff = deg + 90;
image(image2, 0, 0, 25, 180);
if (abs(diff) < 10) {
if (ball.y > 442 && ball.y < 558 && ball.x > 325 && ball.x < 450) {
if (!mySound.isPlaying()) {
serial.write(“C”);
mySound.play();
ball.speedHard = ball.speedHard – 15;
ball.speedb = ball.speedb + random(-10,5);
// see addScore function…
addScore();
}
}
}
}
// bat hits ball
function contactGame() {
var diff = deg + 90;
image(image2, 0, 0, 25, 180);
if (abs(diff) < 10) {
if (ball.y > 442 && ball.y < 558 && ball.x > 325 && ball.x < 450) {
if (!mySound.isPlaying()) {
serial.write(“C”);
mySound.play();
ball.speedHard = ball.speedHard – 15;
ball.speedc = ball.speedc + random(-10,5);
// see addScore function…
addScore();
}
}
}
}
//score counter
function addScore() {
//add one
score++;
//Easter egg sounds
if (score == 5) {
bringEm.play();
}
if (score == 10) {
shaggy.play();
}
}
//scroll through the pitchers when right arrow is pressed
function changePitcher() {
if (sensorValue == 1) {
if (currentImg == kershaw) {
currentImg = thor;
}
}
if (sensorValue == 2) {
if(currentImg == thor) {
currentImg = yu;
}
}
if (sensorValue == 3) {
if(currentImg == yu) {
currentImg = mo;
}
}
if (sensorValue == 4) {
if (currentImg == mo) {
currentImg = wake;
}
}
if (sensorValue == 5) {
if (currentImg == wake) {
currentImg = kershaw;
}
}
}
function adjustStats(){
if(sensorValue == 1){
thorSpecifics();
}
if(sensorValue == 2){
yuSpecifics();
}
if(sensorValue == 3){
moSpecifics();
}
if (sensorValue == 4) {
wakeSpecifics();
}
if(sensorValue == 5){
kershawSpecifics();
}
}
//Displays the score
function printScore() {
textAlign(LEFT);
fill(255, 200);
textSize(40);
textStyle(BOLD);
// image(imgScore, 300, 15, 220, 150);
text(“HITS ” + score, width-350, 185);
if (score == 5){
fill(0, 200);
// textSize(40);
text(“HITS ” + score, width-350, 185);
textAlign(CENTER);
text( “HOMERUN!”, width/2, 50);
}
if (score == 10) {
fill(0, 200);
// textSize(40);
text(“HITS ” + score, width-350, 185);
textAlign(CENTER);
text( “Grant Slam!”, width/2, 50);
}
if (score == 15){
fill(0, 200);
// textSize(40);
text(“HITS ” + score, width-350, 185);
textAlign(CENTER);
text( “Fasten Your Seatbelts!”, width/2, 50);
}
if (score == 20){
fill(0, 200);
// textSize(40);
text(“HITS ” + score, width-350, 185);
textAlign(CENTER);
textSize(20);
text( “Wicked Clutch Hittah!”, width/2, 50);
}
}
function barDisplay(){
noStroke();
fill(90, 200);
rect(25, 545, 190, 40);
}
function pitchText(){
textStyle(BOLD);
textAlign(CENTER);
textSize(10);
text(“PITCH | SPEED”, 120, 540);
}
function textDisplay(){
strokeWeight(2);
stroke(50);
textSize(20);
textStyle(BOLD);
textAlign(CENTER);
}
function printList(portList) {
for (var i = 0; i < portList.length; i++) {
// println(i + ” ” + portList[i]);
}
}
function openPort() {
serial.write(‘x’);
console.log(“port 1”);
}
function openPortTwo() {
serialTwo.write(‘x’);
console.log(“port 2”);
}
function openPortThree() {
serialThree.write(‘x’);
console.log(“port 3”);
}
//accelerometer/vibrating sensor
function serialEvent() {
var inString = serial.readStringUntil(‘\r\n’);
if (inString.length > 0) {
if (inString !== ‘hello’) {
var values = split(inString, ” “);
if (values.length > 0) {
batX = Number(values[0]);
// batY = Number(values[1]);
// batZ = Number(values[2]);
}
//console.log(batX);
}
serial.write(‘x’);
}
}
// button
function serialEventTwo() {
var inStringTwo = serialTwo.readLine();
if (inStringTwo.length > 0) {
inStringTwo = inStringTwo.trim();
sensorValue = inStringTwo;
//console.log(sensorValue);
//sensorValue = Number(inString/4);
}
}
//FSR’s
function serialEventThree(){
var inStringThree = serialThree.readStringUntil(‘\r\n’);
//console.log(inStringThree);
if (inStringThree.length > 0) {
if(inStringThree !== ‘hello’) {
var valuesFSR = split(inStringThree, ” “);
if (valuesFSR.length > 2) {
ballX = Number(valuesFSR[0]);
ballY = Number(valuesFSR[1]);
ballZ = Number(valuesFSR[2]);
//console.log(ballX);
}
}
serialThree.write(‘x’);
}
}
function thorSpecifics(){
p = 0;
k = 5;
r = 50;
s = -9.0;
q = 5.0;
b = 101.4;
cOne = 255;
cTwo = 255;
cThree = 0;
cFour = 244;
cFive = 66;
cSix = 66;
bigList = [];
wakeAdj = 400;
knuckle = 0;
pitchMapMov = map(PitchxMov, s, q, -7, 4);
}
function yuSpecifics(){
p = 2;
k = 7;
r = 50;
s = -10.0;
q = 10.0;
b = 101.4
cOne = 255;
cTwo = 255;
cThree = 0;
cFour = 244;
cFive = 66;
cSix = 66;
bigList = [];
wakeAdj = 400;
knuckle = 0;
pitchMapMov = map(PitchxMov, s, q, -7, 4);
}
function moSpecifics (){
p = 3;
k = 1;
r = 50;
s = -10.0;
q = 5.0;
b = 101.4;
cOne = 0;
cTwo = 0;
cThree = 205;
cFour = 244;
cFive = 66;
cSix = 66;
bigList = [];
wakeAdj = 400;
knuckle = 0;
pitchMapMov = map(PitchxMov, s, q, -7, 4);
}
function wakeSpecifics(){
p = 4;
k = 1;
r = 40;
s = -9;
q = 5;
b = 77.0;
cOne = 255;
cTwo = 255;
cThree = 0;
cFour = 255;
cFive = 105;
cSix = 180;
wakeAdj = 250;
pitchMapMov = 0;
knuckle = random(-10, 10);
bigList = [];
}
function kershawSpecifics(){
p = 1;
k = 4;
r = 30;
s = -9.0;
q = 5.0;
b = 101.4;
cOne = 255;
cTwo = 255;
cThree = 0;
cFour = 244;
cFive = 66;
cSix = 66;
wakeAdj = 400;
knuckle = 0;
pitchMapMov = map(PitchxMov, s, q, -7, 4);
bigList = [];
}
function pitchDisplay(){
//kershaw
if(currentImg == kershaw && sensorValue == 5 && pitchSelector == 0 && ball.y > height){
textDisplay();
//red
fill(255, 102, 102);
text(“Fastball: ” + PitchSpeed + ” MPH”, 120, 570);
}
if(currentImg == kershaw && sensorValue == 5 && pitchSelector == 1 && ball.y > height){
textDisplay();
//yellow
fill(255, 255, 0);
text(“Curveball: ” + PitchSpeed + ” MPH”, 120, 570);
}
if(currentImg == kershaw && sensorValue == 5 && pitchSelector == 2 && ball.y > height){
textDisplay();
//cyan
fill(66, 244, 235);
text(“Change-Up: ” + PitchSpeed + ” MPH”, 120, 570);
}
if(currentImg == kershaw && sensorValue == 5 && pitchSelector == 3 && ball.y > height){
textDisplay();
//purple
fill(236, 179, 255);
text(“Slider: ” + PitchSpeed + ” MPH”, 120, 570);
}
//Thor
if(currentImg == thor && sensorValue == 1 && pitchSelector == 0 && ball.y > height){
textDisplay();
//red
fill(255, 102, 102);
text(“Fastball: ” + PitchSpeed + ” MPH”, 120, 570);
}
if(currentImg == thor && sensorValue == 1 && pitchSelector == 1 && ball.y > height){
textDisplay();
//yellow
fill(255, 255, 0);
text(“Curveball: ” + PitchSpeed + ” MPH”, 120, 570);
}
if(currentImg == thor && sensorValue == 1 && pitchSelector == 2 && ball.y > height){
textDisplay();
//cyan
fill(66, 244, 235);
text(“Change-Up: ” + PitchSpeed + ” MPH”, 120, 570);
}
if(currentImg == thor && sensorValue == 1 && pitchSelector == 3 && ball.y > height){
textDisplay();
//purple
fill(236, 179, 255);
text(“Slider: ” + PitchSpeed + ” MPH”, 120, 570);
}
if(currentImg == thor && sensorValue == 1 && pitchSelector == 4 && ball.y > height){
textDisplay();
//green
fill(0, 255, 0);
text(“Sinker: ” + PitchSpeed + ” MPH”, 120, 570);
}
// Darvish
if(currentImg == yu && sensorValue == 2 && pitchSelector == 0 && ball.y> height){
textDisplay();
//red
fill(255, 102, 102);
text(“Fastball: “+ PitchSpeed + ” MPH”, 120, 570);
}
if(currentImg == yu && sensorValue == 2 && pitchSelector == 1 && ball.y>height){
textDisplay();
//yellow
fill(255, 255, 0);
text(“Curveball: ” + PitchSpeed + ” MPH”, 120, 570);
}
if(currentImg == yu && sensorValue == 2 && pitchSelector == 2 && ball.y>height){
textDisplay();
//cyan
fill(66, 244, 235);
text(“Change-Up: “+ PitchSpeed + ” MPH”, 120, 570);
}
if(currentImg == yu && sensorValue == 2 && pitchSelector == 3 && ball.y>height){
textDisplay();
//purple
fill(236, 179, 255);
text(“Slider: “+ PitchSpeed + ” MPH”, 120, 570);
}
if(currentImg == yu && sensorValue == 2 && pitchSelector == 4 && ball.y>height){
textDisplay();
//green
fill(0, 255, 0);
text(“Sinker: ” + PitchSpeed + ” MPH”, 120, 570);
}
if(currentImg == yu && sensorValue == 2 && pitchSelector == 5 && ball.y>height){
textDisplay();
//blue
fill(102, 163, 255);
text(“Cutter: “+ PitchSpeed + ” MPH”, 120, 570);
}
if(currentImg == yu && sensorValue == 2 && pitchSelector == 6 && ball.y>height){
textDisplay();
//orange
fill(255, 165, 0);
text(“Two-Seam: “+ PitchSpeed + ” MPH”, 120, 570);
}
//Rivera
if(currentImg == mo && sensorValue == 3 && pitchSelector == 0 && ball.y>height){
textDisplay();
//red
fill(255, 102, 102);
text(“Fastball: “+ PitchSpeed + ” MPH”, 120, 570);
}
if(currentImg == mo && sensorValue == 3 && pitchSelector == 1 && ball.y>height){
textDisplay();
//blue
fill(102, 163, 255);
text(“Cutter: “+ PitchSpeed + ” MPH”, 120, 570);
}
//Wakefield
if(currentImg == wake && sensorValue == 4 && pitchSelector == 0 && ball.y>height){
textDisplay();
//pink
fill(255, 105, 180);
text(“Knuckleball: “+ PitchSpeed + ” MPH”, 120, 570);
}
}
//Timer Interval Set – run function every 1000millis
function startTimer() {
clockStart = 60;
//console.log(‘timer starting’);
interval = setInterval(timerShmimer, 1000);
}
//Timer subtract and stop when you get to 0
function timerShmimer() {
clockStart–;
if (clockStart === 0) {
clockStart = 0;
clearInterval(interval);
noMatter.play();
}
}
//display for Timer
function printTimerShmimer() {
textSize(40);
fill(255, 200);
textAlign(LEFT);
text(” TIME ” + clockStart, width-400, height-520);
// text(clockStart, width-200, height-525);
}
//SWITCH BETWEEN THE MODES**PITCHERS IN GAME MODE
function keyPressed() {
if (keyCode == UP_ARROW) {
swinging = true;
} else if (keyCode == RIGHT_ARROW) {
gameMode = ‘EASY’;
} else if (keyCode == LEFT_ARROW){
gameMode = ‘HARD’;
} else if (keyCode == DOWN_ARROW){
gameMode = ‘GAME’;
}
if (keyCode == ENTER) {
if (currentImg == kershaw) {
sensorValue = 1;
currentImg = thor;
} else if (currentImg == thor) {
sensorValue = 2;
currentImg = yu;
} else if (currentImg == yu) {
sensorValue = 4;
currentImg = wake;
} else if (currentImg == wake) {
sensorValue = 3;
currentImg = mo;
} else if (currentImg == mo) {
sensorValue =5;
currentImg = kershaw;
}
}
return false;
}
//swings the bat upon click
function mousePressed() {
// console.log(“mouse pressed”);
swinging = true;
}
function keyPressed() {
if (keyCode == UP_ARROW) {
gameMode = ‘MENU’;
} else if (keyCode == RIGHT_ARROW) {
gameMode = ‘EASY’;
} else if (keyCode == LEFT_ARROW){
gameMode = ‘HARD’;
} else if (keyCode == DOWN_ARROW){
gameMode = ‘GAME’;
}
if (keyCode == ENTER) {
if (currentImg == kershaw) {
sensorValue = 1;
currentImg = thor;
} else if (currentImg == thor) {
sensorValue = 2;
currentImg = yu;
} else if (currentImg == yu) {
sensorValue = 4;
currentImg = wake;
} else if (currentImg == wake) {
sensorValue = 3;
currentImg = mo;
} else if (currentImg == mo) {
sensorValue =5;
currentImg = kershaw;
}
}
return false;
}
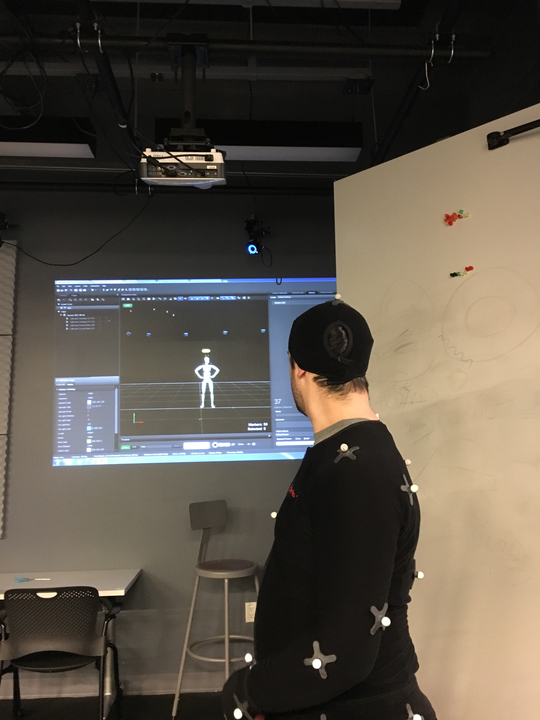
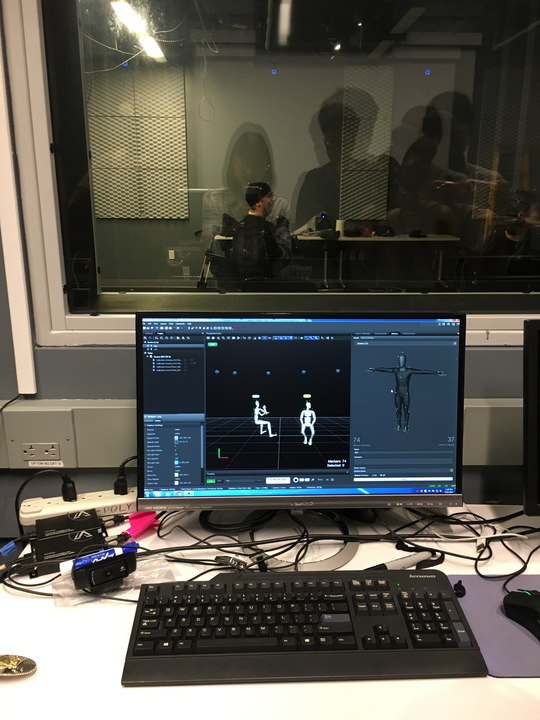
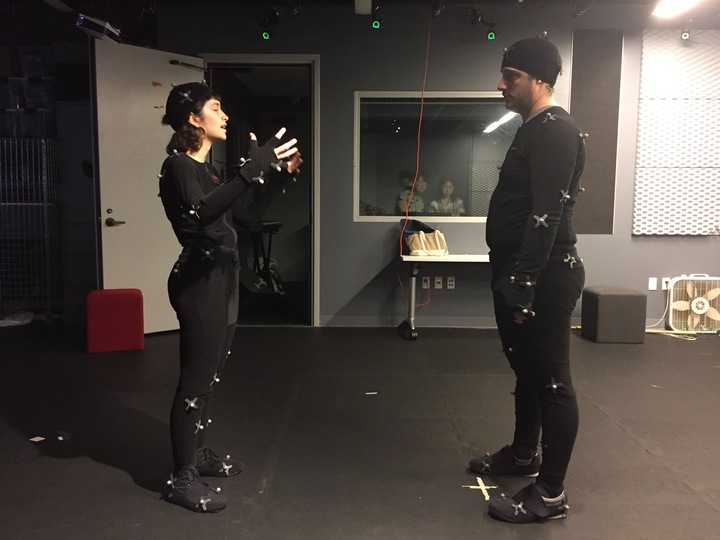
The above video is from a midterm that was the first step towards creating an interactive batting cage that allows users to face off with real pitchers from Major League Baseball. The midterm featured a hollowed out plastic bat fitted with an accelerometer along with an Arduino Uno and is programed so that when a certain location is reached, a swing occurs in a p5 sketch. The p5 sketch itself is a rudimentary batting practice where a “fastball” is thrown at the same speed every few seconds.
While this was certainly enjoyable, it definitely was a bit easy. The next step is to take actual data from five separate pitchers – Noah Syndergaard, Clayton Kershaw, Yu Darvish, Mariano Rivera and Tim Wakefield – and code it into the sketch. Rather than use all of the data made available though – my source for all of this is Fangraphs – I boiled it down to what was essential for the sketch: the pitcher’s arsenal, the max/min velocity for each speed, the frequency which it was thrown and it’s xMov. The bat will also be fitted with a vibrating motor disc and haptic motor controller so that when the user gets a hit the bat will vibrate depending on if they made good contact or not. Let’s say the user is having too much difficulty hitting Clayton Kershaw. They can press a button located on the batting helmet they will be wearing to change pitchers. Let’s say the best the Show has to offer is too difficult for them. They can step on home plate to change game modes. Ultimately, when this is all said and done, I would love to take the final and make it a VR experience.
If you’re interested in seeing the final first hand it will be on display at the ITP Winter Show on December 18th and 19th and you can check my progress with it here.
P.S. In case you’re thinking to yourself: “Rivera? Wakefield?!” I’ve got two friends working on the project who are Yankees and Red Sox fans and while I am a die-hard Orioles fan, I couldn’t bring myself to put Dylan Bundy or Mike Mussina or like…Kevin Brown – can you believe he was an Oriole? – into the sketch. Though a part of me wanted to put Arrieta in there and just have him throw his cutter as a big middle finger to the Orioles pitching staff.
The below is an example and is much better viewed in full screen
So for this assignment I knew that I wanted to do something with baseball data. Luckily for me, baseball data is plentiful and easy to access; my go to is Fangraphs.
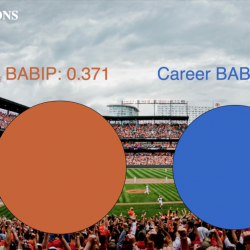
It’s easy to visualize baseball data but difficult to do so in a way that can be revealing. Anyone can great a histogram of all the HR’s that have been hit in June or by left handed batters, but that data visualization doesn’t really serve to reveal anything. I was curious in how the data can inform me of something that I didn’t know before.
In the past ten years or so, or definitely since the release of the novel and movie Moneyball, the baseball world has been obsessed with sabermetrics which is the application of statistical analysis to baseball. One of the key statistics to come out of the sabermetrics movement has been BABIP which can be described in depth if you click the link in the sketch. For better or worse though, it’s essentially a comparative statistic that reveals how lucky a batter has been in a given stretch. There is a career BABIP that is only created after 1,000 at-bats, and a players more recent numbers are compared to his career numbers to see if he’s getting luckier than usual or not.
This sketch is the beginning of what I hope to be a bigger project which is generating my own Fantasy Baseball draft software. I’d love for users to be able to have these sort of visual comparisons for a lot more fields than just BABIP.