I don’t know what you’re thinking but I can take a good guess: this is it?
Yea. This is it. And this took a hell of a long time to get to, too.
Let’s start from the beginning.
Obviously the country is steeped in turmoil right now, especially regarding immigration. To me, immigrants are a vital part of this nation; they’re the fabric that keeps it together. I wanted to show this by reifying the silhouette of the United States of America. I went into the CSV and took out information that I didn’t think was going to benefit my piece: all of the generalized immigrant data that didn’t pertain to a certain country. I removed Northern Europe, Western Europe, Southern Europe and any other dataset that generalized a grouping of countries because I only wanted information from specific nations. With my CSV set, I began to bring in the data to the processing sketch. As I was looking at our class example, I realized that I wanted to see not just the immigrant numbers but how they relate to the population of the US in general. 386,529 is a big number (that’s the amount of Russian immigrants) but when you contextualize it with America’s population of over 324 million, it’s quite literally infinitesimal. .0012% to be exact. So what about the largest percentage of immigrants, Mexicans? The country seems to be enamored with the logic that they’re “taking our jobs”, so how much of the population do they actually represent? 20%? 30? Try 3%. What about Syrians? .00025%. Less than 1 in every 2,500 Americans is an immigrant. All this excitement in the nation about a sect of people that American citizens may actually never meet?
So how do I visualize that sentiment? It’s like asking the question how do you visualize the fact that a gay couple getting married in San Francisco will have literally no affect on a heterosexual marriage in Arkansas.
I tried placing the data on a silhouette of the US in a few different ways: as lines coming down the screen, as rectangles placed in the center, as ellipses bubbling up from beneath. The lines looked like blood which seemed to perpetuate a narrative that these peoples were somehow violent, the rectangles weren’t aiding to a narrative and the ellipses just didn’t seem appealing.
Then I had an idea. If it is in fact the case that there are far fewer immigrants in this nation than people think (immigrants being defined as someone whose place of birth was not the United States) why try to “show” it when I could just …show it. Truthfully. Proportionally.
So I had the idea to show two American flags. At a distance, they appear exactly the same, like an infuriating piece of modern art that leaves a viewer to think “why is this piece in a museum?” As you get closer you begin to see minute specs embedded in the flag. And as you get even closer, you start to realize that there is something that isn’t quite right, there are white squares that cover the flag. A closer look reveals there are more. If you pair that with the knowledge that there are 47,258,315 immigrants in the United States from 133 different countries you really that there are even more squares here that are probably far too tiny to be visualized.
The reaction to this is where I am most interested because I think it should reveal partisanship. There are almost two lines of thought: “So if there are so few, why does it matter if we prevent them from coming in” and “How silly is it that we are keeping these people out of our nation.”
Either way, hopefully you see that this isn’t just two flags on a screen placed there without thought. Excited to see the discussion that happens in class tomorrow around it.
For this weeks assignment, I wanted to see if I could create a simple game using different forces. I’ll admit, I spent a bunch of time on video 2.2. Not because it was particularly difficult conceptually but because I had so much fun applying different forces to one object. To me, it immediately took the form of a ball that people were trying to keep balanced in the air. Then it resembled a balloon floating away, then it oddly brought me back to a game I used to play in middle school and high school that I haven’t thought about for YEARS called Bubble Trouble. It was then I realized, that this week I should focus on actually turning this into a rudimentary idea.
I will say my original idea was to have to faces on the screen, one on the left and one on the right. When you pressed the right button the left face would exert a wind force and push a ball towards the right face who would then push it back towards the left face with a wind force of its own. Then I thought maybe it would be cool to make the ball in the center into a flower, and as wind was exerted it’s pedals would fall off but I couldn’t figure out how to illustrate it’s stem and how THAT would bend with the flower.
I eventually decided to focus on a game where the point was to exert as many different forces on the ball as possible. That for some reason began to resemble a sheep herder keeping his sheep in order and not letting them run off. That’s how I came to this:
The code for the sketch is in the google drive located here.
Dream: I am interested in how I can use new technology to enhance a fans live experience at a Major League Baseball game. I want to be able to create something that will be all inclusive: something that both informs the newcomer and engages the baseball fanatic. The ideas implemented should be malleable enough to not just enhance the experience of a baseball game but of all live events.
Vision: The tech would have a lot of features, all of them stemming from your mobile device. One crucial foundation to keep in mind through all of this: the physicality of the experience is one that separates the body from the tech in a realistic fashion. The mobile device will not be covering the eyes as is common with a VR experience. Instead, the user will keep the phone at arms length – as if they are taking a picture – as the AR experience happens. It is crucial that the user isn’t thrown into a virtual reality and that reality exists around them as things are augmented. Now, for the experience:
You and your friend decide to take a road trip to see your favorite team the Baltimore Orioles play the Cleveland Indians at Progressive Field in Ohio. You get your tickets and get to the stadium a bit early to watch some batting practice. Your friend asks you who is in the starting lineup tonight. You turn your camera on, point your phone to the field and from the grass emerges a graphic with the two starting lineups. “Oh, he’s got Manny Machado batting second? Doesn’t he usually bat third?” your friend asks. You highlight Manny Machado’s name and all of his statistics appear. “Nah, he usually bats second.”
“How does he do against this pitcher?”
You pull up a highlight of what happened the last time Manny Machado went up againsst Danny Salazar. It shows him striking out.
“Not so well.”
You sit down and the game begins. After an inning or two, you start to get hungry. “What’s this stadium got by way of food?” your friend asks. You hold your phone up to the stadium and an array of concessions pop up. Above a few of them there is a small star that notates which concession Indians fans feel is a must have, below that there is a review and under that, a timer which indicates how long the line is for that particular concession.
“This place called Melt Bar and Grill has something called the Parmageddon that’s supposed to be great. The line is like 10 minutes but it just won some award for ‘Best Ballpark Food.'”
“Sounds good, mind if I use the restroom before we go?”
You turn your phone around to look for the nearest restroom. Several icons pop up to show you where they are located.
“There’s one close to the concession stand but there’s a five minute wait; the one right outside your section has a one minute wait.”
You get your food, return to your seats and settle in to watch the rest of the game. It’s now the bottom of the 7th. The Orioles are up 4 – 3 but their starter Kevin Gausman has just given up a two out double with Edwin Encarnacion on deck.
“They should bring in Brad Brach,” says you friend.
“No way, let him finish the inning.”
You open your phone and point it to the scoreboard. A poll appears: “What should the manager do: ‘Bring in Brad Brach”, “Keep Gausman in”, “Intentionally walk Encarnacion”.
Your friend votes for the first option and you vote the second. The poll fills up and it turns out 70% of the fans who voted agree with your friend.
The game ends (the Orioles won) and you head back to your hotel room with your friend.
“Man, that was some home run Manny Machado hit, huh?”
“Yea,” you say, “let’s see it again”. You open your app and displayed in AR in your hotel room is that home run Manny Machado hit two hours ago.
Goal: Create a mobile AR app that enhances the viewing experience of a live event. Give the app as much functionality as possible in a one semester span. In the meantime, create a video that shows what the app looks like when it is used optimally.
Plan:
Midterm: Pitch Video
Final: MVP app that includes all functions of the app but with a select few being able to be used.
EDIT: So after the first class, I knew essentially what I was interested in doing for a final project. A little context: My dream is to work for Major League Baseball. I’m currently a freelancer/independent contractor for them in their QA department – I place baseball video games all day – and hope to continue climbing the ladders they provide for me. As a result, a fair amount of the work I produce at ITP is baseball related. Baseball provides me with a context that makes learning new tech just a little bit easier.
With that said, for this assignment, I want to see if there is any correlation between placement of a Major League ballpark and surrounding poverty levels. How does a stadium change the community in which it’s placed? I know this is a bigger project than a final but I figure for the final I can bring in poverty levels of all the areas in which a stadium is located and compare them to poverty levels PRE the building of that stadium. I can also do something where ticket sales are assessed for example: is there a correlation between tickets sales, poverty levels and placement of a stadium.
Below is just information I’ve begun to gather about the poverty rate in each county where the ballpark is located.
Is it better to look at avg attendance per game or total?
Source for all information: US Census Bureau – http://www.census.gov/quickfacts/table/PST045216/00
Angel Stadium of Anaheim in Anaheim, California – Poverty Rate – 16.5%. Total 3,016,142 AVG 37,236 (7th)
AT&T Park in San Francisco – Poverty Rate – 13.2% Total – 3,365,256. AVG – 41,546 (4th)
My first ever Processing sketch isn’t so much about the content as it is an exploration of features that I wasn’t familiar with using outside of P5.
Did I intend to create a David Lynchesque nightmare sequence? Not really. I did want to see if I could randomize an array of photos as well as sounds and implement them into a random walker.
Ideally, I would have liked to keep the random walker from disappearing when the new image was being drawn but I struggled with how to do that. If I don’t clear the canvas, the images never leave, but if I put background in draw, I get what’s happening currently.
There are a shit load of sabermetrics out there, why not something that actually applies them and simulates games with them. Millions of people use FanDuel, thousands of them go on gut feeling. I want a software that allows you to view day-to-day projections and takes everything into account: wind, park factors, past performances, hot/cold streaks, lineup protection, etc.
Customizable fantasy baseball data
There are plenty of apps and softwares out there that allow you to win your fantasy baseball league but I want to build a new one. You should be able to customize your league data, provide json’s or csvs from websites like fangraphs and fantasybaseballpros and figure out an average of what your projections are.
Teaching you how to play music with lights on a guitar
The whole product: a guitar with tiny LED’s at each fret on each string. I’d want to create a software that would allow it to run. It would print scales onto the guitar and other lessons.
A bi-partisan news aggregator
You would input your political beliefs in the beginning and get something similar to the Skim each morning that has pertinent articles from both sides of the fence to help bridge an ever widening gap.
AR baseball
Mix the home viewing experience of a baseball game with the live viewing experience. See the lines at bathrooms, see the most popular places to go, etc.
Making a difference and how to do it.
Build an app where you can donate to particular groups, where you can send e-mails to senators, or call you senators all from one easy app. You’d input your state and location and be given all the information you need. You’d write down the values that you care about and have groups cater to you.
Goodreads for Podcasts
What are your friends listening to right now? Should you be listening too. What are you friends favorite podcasts and their favorite moments from those podcasts?
Easy HTML
A software that even further simplifies the website making process. Something as simple as: I want a website with this photo in the background, I want this to be centered at the top of the page, I want it to be a blog with these hyperlinks, etc.
Fantasy Baseball Optimizer
Allows for customization of taking care of your fantasy baseball team: sets an optimal lineup, alerts you when better options are on the waiver wire, highlights match-ups that could be of benefit to you.
VR Reading
A VR app that serves to be a compendium to a book for a young kid. Experience what Frankenstein looks and feels like as you read it.
UPDATE: FINAL CODE HAS BEEN ADDED TO THE BOTTOM OF THE PAGE
What Does It Take To Be A Major League Baseball Player?
I don’t know if a lot of you are aware but it is very, very difficult to be a Major League Baseball Player. In most professional sports, there are few steps: you play in college, you get drafted, and if you prove good enough you get to play professional football, hockey or basketball. This is not the case in Major League Baseball. If you are 100% the best player in college, if there has never been anyone like you to play the game at the rare age of 18 or 21 you are still placed in a brutal minor league system that can completely control your soul. Let’s take a look at a trailer for the film “A Player to be Named Later” for more information.
I asked this question to give you a better idea of why I love this sport so much: it’s not just a sport it’s a story that grows and changes every single year and never gets boring. There are truly millions of examples of this but let’s stick with one that happened this past year. For those who don’t know, pitchers rarely get the chance to hit. A typical batter will get upwards of 600 – 700 opportunities to get a hit and a pitcher may get like…50 at most. Michael Lorenzon, a pitcher for the Reds this year – got five. Five opportunities to just get a hit. On around August 12th, Michael Lorenzon’s father – whom he was very close with – passed away. After returning from a bereavement list, Lorenzon was put into the game for his team.
This is why I love baseball.
As is true with all things you love, you want to know more about it and maybe try to instill some of that information in others.
When I started learning coding awhile ago, I was a bit terrified because I was in an unfamiliar place. However, when I started using baseball statistics in coding, the experience of discomfort lessened. Coding became secondary, a byproduct of needing to learn how to make baseball more accessible. I started with a simple baseball game:
When I made this, I was super excited. I had finally made a baseball game! Very strange to look back on it now. The evolution of the game is entirely thanks to the introduction of JSON files. They gave me the opportunity to take real baseball data – of which there is an abundance – and apply it to my work. I’ll never forget being late to a bar that night because I was so excited to make this:
After I had fun with this, I decided why not mix the two, which led me to my final. How cool would it be if I could take real data and use it to show the difference in a pitchers arsenal. I’ve seen plenty of videos and .gif’s but something about visualizing the data got me really excited. Luckily, I found two amazing partners – and fellow baseball fans – in Katie Takacs and Grant Henry and after countless hours we made what can only best be shown in a local host.
Here is the final code:
var gameMode = ‘EASY’;
//EASY MODE
var x = 380;
var y = 285;
var speed = 3.5;
var speedb = 0;
var accx = -0.01;
var deg = 0;
var serial;
var serialTwo;
var serialThree;
var ballX, ballY, ballZ;
var batX, batY, batZ;
var portName = ‘/dev/cu.AdafruitEZ-Link71f3-SPP’; ///dev/cu.AdafruitEZ-Link71f3-SPP; for accelerometer
var portNameTwo = ‘/dev/cu.AdafruitEZ-Link743a-SPP’; ///dev/cu.AdafruitEZ-Link743a-SPP; for buttons
var portNameThree = ‘/dev/cu.usbmodem1421′;//’/dev/cu.usbmodem1411’; or whatever port you’re plugged into for FSR’s
var w = 35;
var prevBallY;
var counter = 150;
var batspeed = 5;
//hits counter variables
var score = 0;
var imgScore;
var bringEm;
var shaggy;
var noMatter;
var swinging = false;
//var getHit = false;
var inData;
var outByte = 0;
//HARD MODE
var sensorValue = 5;
var ball, pitchSelector, data, data2;
var bigList = [];
var speedHard = 3;
//p is from 0-4 and determines which pitcher’s stat’s we’re accessing: 0 is Thor, 1 is kershaw, etc
var p = 1;
//k is however many pitches the pitcher has in their arsenal
var k = 4;
// r is the minimumim vel for each pitcher
var r = 30;
//b is second real value in PitchMapMin
var b = 101.4;
//s is first real value in PitchMapMov
var s = -9.0;
//q is second real value in PitchMapMov
var q = 5;
// changes colors in the switch to make colors unanimous across the board
var cOne = 255;
var cTwo = 255;
var cThree = 0;
var cFour = 244;
var cFive = 66;
var cSix = 66;
//pitchers display variables
var currentImg;
var kershaw;
var mo;
var thor;
var wake;
var yu;
//Wake’s variables. Adj makes his movement start earlier, Knuckle allows for his wacky movement
// to be in the code
var wakeAdj = 400;
var knuckle = 0;
// making JSON data global.
var PitchMax;
var PitchMin;
var PitchMapMov;
var PitchMapMax;
var PitchMapMin;
var PitchMapMov;
var PitchrandomSpeed;
var PitchSpeed;
//GAME MODE
var speedc = 1;
// timer variables
var clockStart = 60;
var interval;
var modeEasy = false;
var modeHard = false;
var modeGame = false;
var modeMenu = false;
function preload() {
img = loadImage(‘backgroundField.png’);
image2 = loadImage(‘Bat.png’);
image3 = loadImage(‘baseball.png’);
image4 = loadImage(‘mainMenu3.png’);
mySound = loadSound(‘Cheer.mp3’);
// load pitchers images
kershaw = loadImage(‘kershawTag2.png’);
mo = loadImage(‘moTag.png’);
thor = loadImage(‘thorTag.png’);
wake = loadImage(‘wakeTag.png’);
yu = loadImage(‘yuTag.png’);
//bat hits ball
function contact() {
var diff = deg + 90;
image(image2, 0, 0, 25, 180);
if (abs(diff) < 10) {
if (y > 442 && y < 558) {
if (!mySound.isPlaying()) {
mySound.play();
serial.write(“C”);
speed = speed * random(-4, -1);
speedb = speedb + random(-10, 5);
// see addScore function…
addScore();
}
}
}
}
//}
// send when an event occurs *GAME MODE*
function Thor2(pitch/*frequency*/) {
this.x = 375;
this.y = 220;
this.speedHard = 1;
this.speedc = 0;
this.w = 10;
this.rgb = [0,200,100];
// noprotect
switch (pitch){
//knuckleball will be
case 0:
//red…fastball
this.rgb = [cFour,cFive,cSix];
//console.log(this.rgb);
break;
case 1:
//yellow… curveball
this.rgb = [cOne,cTwo,cThree];
//console.log(this.rgb);
break;
case 2:
//turqouise … change-up
this.rgb = [66,244,235];
//console.log(this.rgb);
break;
case 3:
//purple… slider
this.rgb = [125,66,244];
//console.log(this.rgb);
break;
case 4:
//lime green…sinker
this.rgb = [0,255,0];
//console.log(this.rgb);
break;
case 5:
// blue …cutter
this.rgb = [0, 0, 205];
//console.log(this.rgb);
break;
case 6:
//orange…two-seamer
this.rgb = [255,165, 0];
//console.log(this.rgb);
break;
default:
this.rgb = [0,200,100];
//console.log(‘no color was passed into ball’);
}
PitchMax = data2.pitchers[p].pitches[pitch].MaxVelo;
PitchMin = data2.pitchers[p].pitches[pitch].MinVelo;
PitchxMov = data2.pitchers[p].pitches[pitch].xMov;
//mapping of maximum velocity
PitchMapMax = map(PitchMax, 50, b, 0, 8);
//mapping of minimum velocity
PitchMapMin = map(PitchMin, r, b, 0, 8);
// mapped xMov of fastball
PitchMapMov = map(PitchxMov, s, q, -7, 4);
// pitch velo will randomly vary between max and min
PitchrandomSpeed = random(PitchMapMax, PitchMapMin);
PitchSpeed = Math.round(random(PitchMin, PitchMax));
// send when an event occurs *HARD*
function Thor(pitch/*frequency*/) {
this.x = 375;
this.y = 220;
this.speedHard = 3.5;
this.speedb = 0;
this.w = 10;
this.rgb = [0,200,100];
// noprotect
switch (pitch){
//knuckleball will be
case 0:
//red…fastball
this.rgb = [cFour,cFive,cSix];
//console.log(this.rgb);
break;
case 1:
//yellow… curveball
this.rgb = [cOne,cTwo,cThree];
//console.log(this.rgb);
break;
case 2:
//turqouise … change-up
this.rgb = [66,244,235];
//console.log(this.rgb);
break;
case 3:
//purple… slider
this.rgb = [125,66,244];
//console.log(this.rgb);
break;
case 4:
//lime green…sinker
this.rgb = [0,255,0];
// console.log(this.rgb);
break;
case 5:
// blue …cutter
this.rgb = [0, 0, 205];
// console.log(this.rgb);
break;
case 6:
//orange…two-seamer
this.rgb = [255,165, 0];
//console.log(this.rgb);
break;
default:
this.rgb = [0,200,100];
// console.log(‘no color was passed into ball’);
}
PitchMax = data.pitchers[p].pitches[pitch].MaxVelo;
PitchMin = data.pitchers[p].pitches[pitch].MinVelo;
PitchxMov = data.pitchers[p].pitches[pitch].xMov;
//mapping of maximum velocity
PitchMapMax = map(PitchMax, 50, b, 0, 8);
//mapping of minimum velocity
PitchMapMin = map(PitchMin, r, b, 0, 8);
// mapped xMov of fastball
PitchMapMov = map(PitchxMov, s, q, -7, 4);
// pitch velo will randomly vary between max and min
PitchrandomSpeed = random(PitchMapMax, PitchMapMin);
PitchSpeed = Math.round(random(PitchMin, PitchMax));
//Timer Interval Set – run function every 1000millis
function startTimer() {
clockStart = 60;
//console.log(‘timer starting’);
interval = setInterval(timerShmimer, 1000);
}
//Timer subtract and stop when you get to 0
function timerShmimer() {
clockStart–;
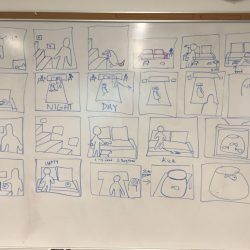
When we received this assignment I had a narrative in mind that I was very anxious to explore and, not wanting to force my ideas on anyone in the class, I decided to go it alone. This wasn’t necessarily the best choice: I don’t know a thing about After Effects or Photoshop. With that said, I knew I had a little extra time to pursue the project so I figured I’d give it a shot.
Having already had a fully fledged narrative in mind, the first part of the process was quite easy. It was everything thereafter that was a complete nightmare. I knew I wanted to use and old man character but I didn’t want to rely on my non-existent Illustrator skills to create one. Instead I decided to use photos of someone that I knew would be in abundance online: Samuel Beckett. With that solution a new problem arose. How was I going to be able to use photoshop to turn Beckett into the character I needed him to be?
Enter Rebecca’s Photoshop tutorial. Thanks to her screen record of that class I was able to do all the things I needed to do with Beckett and all of my other characters. When it came to learning After Effects however, I stuck to the simple basics: the pin tool, keyframes, etc.
There were definitely sometimes I had to adapt my narrative to limited After Effects ability I had but I think the changes ended up working. While the animation in and of itself is no great shakes to look at, I’m proud that the story is – I think – clear and the message is similar to the one I intended to tell at the assignments outset.
I am a baseball fan. Have been since I was a little kid and will likely be till the day I die. To me the sport transcends the physical space it is played on and enters into a narrative and symbolic realm. When you tend to be vocal about baseball like I am, you hear a lot of rebukes: “How hard could it be?” “Why are the players so fat?” “It’s so boring.” Well, to quote the great Red Barber, “Baseball is dull only to dull minds” and I guess I intend to do some sharpening. My ICM finale will attempt to educate users about baseball by having them play the sport themselves. I hope to show them the nuance, the beauty and the difficulty of the sport both visually and physically.
I know a good amount about baseball, which is to say I know about…oh, let’s say 30% of what baseball has to teach. One area that I struggle with is pitch recognition. For those unfamiliar, a pitcher has a certain arsenal with which he throws i.e. a fastball, a changeup, a curveball and a slider. If I were to describe these pitches to you they would sound very different but when they are moving at 90+ MPH, they’re hard to tell the difference. How can I create something that helps pitch recognition but isn’t just me sitting down at a screen and watching baseball highlights?
“Baseball is ninety percent mental and the other half is physical”
Over the summer I started working for a baseball website that does exactly what I am looking to do. I guess I was sort of curious as to how I could make this visual experience a more interactive one. For my PComp Midterm, I took the following sketch and replaced the mouse-pressed bat with an actual physical bat but this was just the beginning. What I aim to do with my ICM final is to make this a full-fledged experience. There will be a home plate that is essentially a trigger for three different modes. If you tap on the green part of the plate, the p5 sketch will throw fastballs right down the middle; this will be “Easy Mode”. If you tap on the yellow part of the plate, there will be a “Hard Mode” that features more challenging pitches like curveballs and sliders. If you press the red part “Game Mode”, an image will appear in the top left hand corner of the sketch featuring a pitcher who you will face off against.
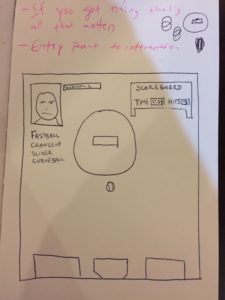
Due to the fact that this is both a PComp and an ICM final, I’ve spent a bit more time focusing on the physical elements first as I feel that it will dictate what the ICM final ends up looking like. Truth be told though, it wasn’t until I play test the PComp idea that I got a lot of great feedback on what the ICM sketch should incorporate. Below is a tentative sketch as to what the screen will look during “Game Mode”.
As you can see, there’s a mound and a ball being thrown towards you. There’s a batter’s box and a home plate, which will resemble what the user is actually standing on: a grass batters box next to a home plate. In the top left hand corner will be the face of the pitcher you are facing off against. Below him will be his arsenal. In the center of the screen there will be a scoreboard keeping track of how much time you have left to accrue hits and a hit counter.
Code
Luckily, a big part of the actual code is done due to my midterm, but there is still a lot left to accomplish. I need to create my own JSON file with various pieces of data from the pitchers we want to incorporate into the sketch. I need to figure out a way to map that data so that it appears accurately and realistically into the sketch too. After that, we can work on the other, more aesthetic features. Work has already begun on creating a button that can switch between different pitchers and is featured below (code here).
More?
As of now, there are still a lot of things that can be added and subtracted from the experience. I’m interested in providing as much information as possible while maintaining clarity in the sketch. The last thing I would want would be for the user to be overloaded with information. I would like to provide just enough for them to develop a genuine curiosity about baseball so that they might pursue an interest in it in the future.
The Future
Ultimately, I would love to take this an put it into an even more immersive 3D experience. I feel like you’ll be able to get a good understanding of pitch recognition on a 2D plain, but you won’t be able to fully get it until you experience it in 3D.
Update!
Since last week, there have been a lot of strides made, here are a few of them:
Frequency.
The particular sketch that you are looking at is not only representative of the arsenal that Noah “Thor” Syndergaard threw in the 2016 season but also represents how frequently he threw said pitch:
Stadium and Scoreboard
This sketch shows a close resemblance to what the final product will look like. The pitchers will be able to be rotated (here it is using the keypressed function but in the final you will press a button located on the helmet (see video)), and a scoreboard will tally how many hits you’ve gathered.
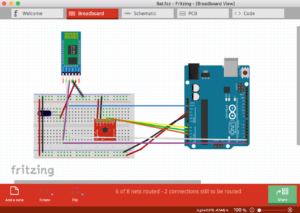
As of right now, the plan is to replace the Arduino Uno that was used for the mid-term with an Arduino 101 and its built in accelerometer. My group and I are also interested in possibly making a custom built bat but as of now, we’re going to stick with the plastic model. The force sensing resistors will be placed on top of home plate and will be used to change game modes and the mini motor disc and haptic motor controller will be placed inside of the bat so that they can vibrate whenever the user gets a hit. The ply will be cut to make a more realistic batters box and will be covered in fake turf. This is solely an aesthetic choice, one that hopefully makes the atmosphere a bit more vibrant.
In terms of the Fritzing: I feel like this will change a lot because my group is interested in getting away from the Arduino 101 but I figured it would be helpful to include the schematic used for the mid-term in case it was needed in the future. Unfortunately, the Fritzing software doesn’t include the proper model of accelerometer used (the ADXL335 is included but looks drastically different from the one I used) nor the proper Bluetooth but I think it portrays a somewhat accurate schematic.